Parabolic SAR Indicator: Technical analysis plays a major role in analysing the securities from both trader’s and investor’s perspectives.
Among all technical indicators, the Parabolic SAR indicator has its own importance under the technical analysis of securities.
Here, we shall discuss the Parabolic SAR indicator with its strategies, calculations, charts and applications. Which helps market participants analyse their potential views on trends, reversals and strong entry/exit opportunities.
What is Parabolic SAR Indicator?
J.Welles Wilder developed a technical indicator tool called Parabolic SAR, where SAR stands for “Stop and Reverse”.
It is used by market participants to determine the price direction and trend reversal of security.
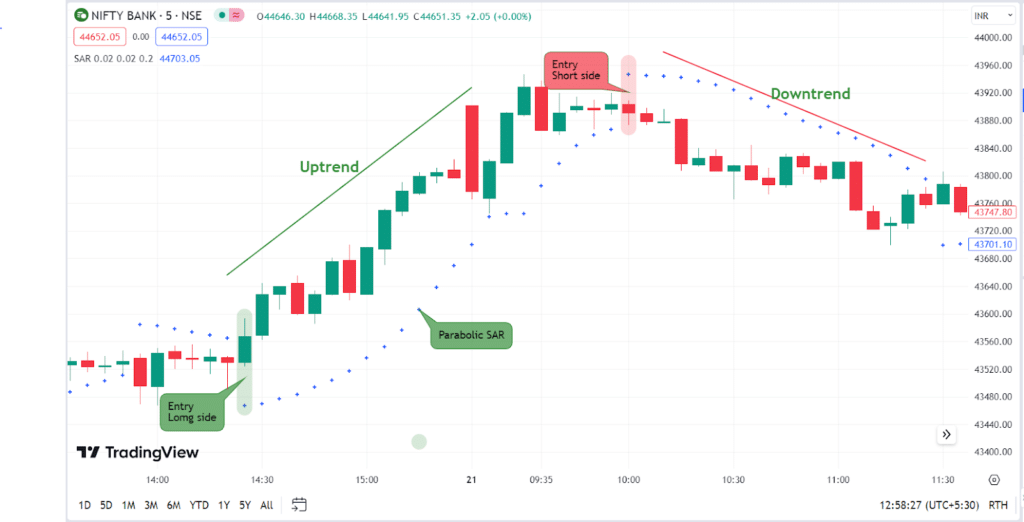
The indicator trails the price as the trend extends, it is represented as a series of dots above or below the candlesticks on the price chart.
When the price line is above the series of dots, then the security is bullish and in an uptrend. However, when the series of dots is below the price of a security, it implies being bearish in a downtrend over a period of time.
How to Calculate Parabolic SAR?
The indicator is represented on the chart of security as a series of dots, which are placed based on the momentum of the security.
The parabolic SAR is calculated separately based on the uptrend and downtrend of security to determine the position of the dot series in a trendline.
For, raising parabolic SAR in an uptrend of security, the formula is
PSAR = Prior PSAR + Prior AF (Prior EP – Prior PSAR)
Where,
PSAR = Parabolic SAR
EP = Extreme Price, it is the latest higher high of the security in an uptrend.
AF = Acceleration Factor is set to default at 0.02, increased by 0.02 for each new EP up to a maximum value of 0.20.
The formula for falling parabolic SAR in a downtrend of security is
PSAR= Prior PSAR – Prior AF (Prior PSAR – Prior EP)
Where,
PSAR = Parabolic SAR
EP = Extreme Price, it is the latest lower low of the security in a downtrend.
AF = Acceleration Factor is set to default at 0.02, increased by 0.02 for each new EP up to a maximum value of 0.20.
Trading Strategies with Parabolic SAR Indicator
We shall learn how to use the below-listed strategies of parabolic SAR to analyse the securities.
Trends with Parabolic SAR
As we know parabolic SAR is a trend indicator, we use the indicator to identify potential trends for entry/exit signals.
If the dot series formed by parabolic SAR is below the price of security then the security is said to be in uptrend. Here, one can place the trade for a long position or can trail the stop loss for the existing position.
On the other hand, if the security price is below the dot series formed by parabolic SAR then the security tends to be in a downtrend. Here, the traders can place a short position or can trail the stop loss for the existing short position.
Exiting Trade Positions
Parabolic SAR generates potential exit signals to the current position for better risk-reward management. We have learnt above, how the trend movements are identified using Parabolic SAR.
If the security is in an uptrend, then a change in the Parabolic SAR dot series from below the price levels to above the price levels will indicate an exit signal for the existing long position.
In case of a downtrend, if the dot series of parabolic SAR shifts from above to below the security’s trading price, then a sell signal is generated on an existing short position.
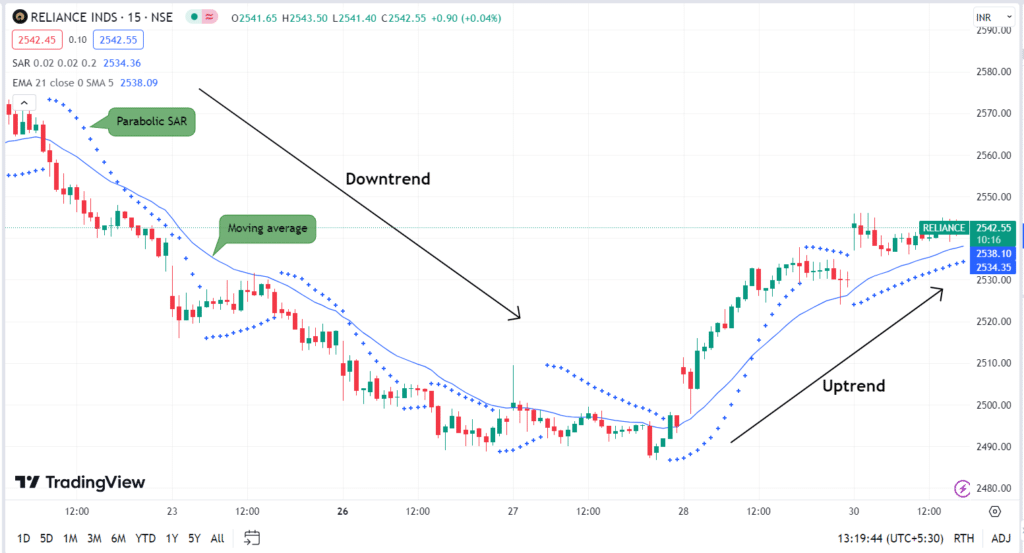
Parabolic SAR Moving Average Strategy
The most used technical indicator by traders is moving averages.
Moving averages are a technical indicator that is calculated as an average of the past closing price of the security over a specific period. Traders combine different time period moving averages with the Parabolic SAR indicator to identify early trends and entry/exit opportunities.
When the price of a security is below the moving average then a downtrend is registered and when the security price is above the moving average then the price trend is said to be an uptrend.
If the above price cross-over corresponds with the Parabolic SAR indicator then a confirmed uptrend or downtrend can be understood.
Moving average crossovers also help traders identify early trend reversals to manage the risks involved in the current position.
Along with Moving averages, Parabolic SAR can also be used with other technical indicators like the Relative Strength Index(RSI) and the Average Directional Index(ADX) as a trend trading tool.
Traders can set up the Parabolic SAR indicator to any of the time frames based on their own strategies or views to tune up the securities.
Limitations with Parabolic SAR Indicator
- The Parabolic SAR constantly generates signals. Generally, in rangebound markets, the signals generated may be of poor quality, therefore significant trend identification will be difficult.
- It is a lagging indicator.
- If the indicator constantly moves above and below the price of the security then it is difficult to identify trend reversal too. A false reversal signal may get a trader out of the position even though the price hasn’t actually reversed. Hence, it is advised not to completely rely only on the Parabolic SAR indicator.
In Closing
It is understood that the importance of the indicator helps traders to consistently identify potential trends, reversals and entry/exit opportunities along with risk management.
The series of parabolic dots above the price indicate the uptrend and below the price indicates the downtrend of security.
As a trader, entry or exit of positions with confirmation adds more value, hence it is highly recommended to combine other technical analysis tools with the lagging parabolic SAR indicator to have a better understanding of the price movement of a security.


 Free Download Patterns")