What is Morning Star Candlestick Pattern: Candlestick patterns are part of technical analysis used by traders to read the price movement of securities more accurately.
Bullish and bearish candlestick patterns help traders spot trends and reversals with potential entry or exit opportunities in the price of a security.
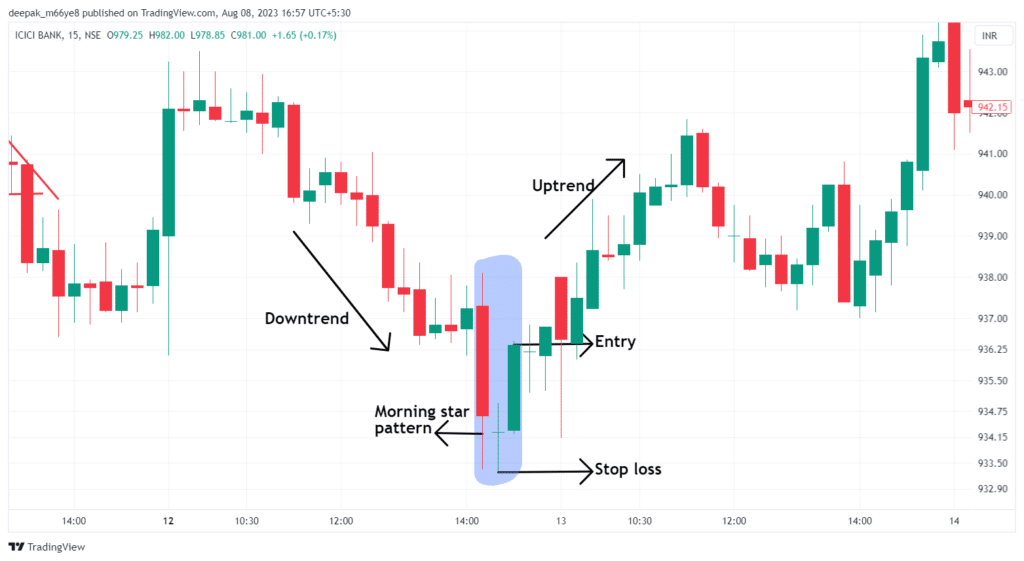
The morning star candlestick pattern is a bullish pattern used to identify the price reversal in a downtrend with a well-defined entry, stop loss and target with good risk management.
In this article, we shall learn What is Morning Star Candlestick Pattern with its meaning, the pattern formation and the strategies involved to trade with a better understanding of price movement.
What is Morning Star Candlestick Pattern?
The Morning Star pattern is a type of bullish candlestick pattern used by traders to analyse the price movement of securities.
A prior downtrend followed by a morning star pattern indicates a trend reversal towards an uptrend.
The morning star pattern is a technical analysis tool consisting of 3 candles, a large red candle, a small-bodied candle(Doji) and a red candle.
The pattern formed at the bottom of a downtrend signifies that the downtrend is about to end, traders can either use this pattern to exit a downtrend or enter an uptrend.
It is the opposite of the Evening Star Pattern, which is a bearish candlestick pattern.
Formation of Morning Star Candlestick Pattern
The Morning Star Pattern is formed by a combination of three candles with a strong prior downtrend.
The three candles are:-
- Long Red candle
- Small-bodied candle(Doji)
- Long Green candle
- Red candle:- A strong red candle is formed at the bottom of a downtrend indicating strong selling with bears in control.
- Small-bodied candle(Doji):- Firstly, Doji is a type of candle with a small (or no) green or red body formed when the market opens and closes at the same level or almost the same level indicating indecision of price movement with buyers and sellers.
The Doji formed after a red candle in the morning star pattern indicates uncertainty in the price movement, in which a price reversal can be seen in the prior downtrend towards the uptrend in security.
- Green Candle:- After the Doji candle is formed, as a confirmation of the trend reversal, a long green candle is formed, indicating more buying pressure towards the uptrend.
Morning Star Candlestick Pattern Trading Strategies
Once the Morning Star Pattern is formed, traders can find entry/exit opportunities with a better view of trends.
Entry, Stop loss and Target.
Morning Star Pattern gives a good opportunity to spot trend reversal and trading signals.
Entry:- When the price of security forms the Morning Star Pattern, traders can enter a long position in the security after the close of a long bullish candle to ride the uptrend.
Stop loss:- The stop loss for a trade with the morning star pattern will be the low of a doji candle formed in security.
Target:- Targets are based on better risk-reward ratios. Here, the risk is from entry to stop loss and the reward is from entry to target. If the risk is 1 part, the reward can be 2 part or 3 part which is 1:2 or 1:3.
The target can be set to the resistance level formed above the entry in security and also, traders can trail the stop loss to achieve higher targets in security.
Relative Strength Index(RSI) with the Morning Star Pattern
RSI is a technical indicator which oscillates between 0 to 100 indicating overbought and oversold levels.
When the RSI indicator oscillates above the 70 level, it is considered that the price of a security is trading in an overbought zone and a downward price movement is to be expected.
When the RSI indicator is oscillating below 30 levels then it is understood that the price of security is trading in an oversold zone and an upward price movement is to be expected.
Using the overbought and oversold zones depicted by the RSI indicator, we shall discuss how to find confirmation of entry/exit opportunities of the morning star pattern formed on the chart.
We know that entry in the morning star pattern is after the close of a long green candle.
Upon confirmation of the entry, if the RSI indicator oscillates to the oversold zone, then the oversold zone of the RSI indicator confirms the uptrend along with the morning star pattern.

Pros and Cons of Morning Star Candlestick Pattern
The bullish morning star pattern has both pros and cons.
Pros:-
- Morning Star candlestick pattern is frequently identified on charts.
- The entry and targets are well-defined with the pattern.
- Stop loss levels of the pattern give good risk-reward ratios.
Cons:-
- The false signal of a reversal in the pattern could end up making prices move lower resulting in the failure of trade.
- Sometimes a tight stop loss in the pattern can trigger the order too often.
- The morning star candlestick pattern is preferred with other technical tools for a better and confirmed view.
In Closing
It is reliable bullish candlestick pattern implemented by traders for potential views on entry/exit opportunities of the security.
With the above-discussed concepts what is Morning star candlestick pattern and strategies, traders can build a profitable setup with the bullish morning star candlestick pattern to identify the trend reversal and gain the most from the uptrend trade.
 Free Download Patterns")